🡴 Up to the list of all exercises
Question 1
In this exercise, we will prepare the Framsticks environment and the Python evolution interface to work.
- Download the Framsticks simulator – the most recent zip from here and uncompress it in some directory. Note the directory where the frams-objects.dll/.so/.dylib library is – the python scripts will need it.
- Download "framspy" (Python interface to Framsticks) which is this entire directory. It is best to download it using the svn client (
svn checkout) or the git client (git svn clone); the https certificate only encrypts but does not confirm the website's identity, so you may encounter warnings. - Verify the cooperation of the python code and the simulator – make sure that this works without errors:
python frams-test.py <path-to-frams-objects-library>. - Install the DEAP framework in Python.
- Copy all
*.simfiles from the downloaded "framspy" repository to thedata/directory in the uncompressed Framsticks distribution. - Edit
run-deap-examples.cmdand update theDIR_WITH_FRAMS_LIBRARYpath, run this script and ensure that evolution works. Converting this script for Linux is trivial.
We will now build the first simple structure and simulate it.
- Run
Framsticks.exe(under linux and macos you can use wine) - Press the "New" button on the left in the middle window, and in the "Genotype" field type
/*9*/LUR - The leading "comment"
/*9*/means that we are using the genetic representation denoted by the symbol 9; this encoding is shortly denoted as f9 ("f" as in "genetic format") - You can use six letters (Left, Right, Down, Up, Back, Forth) to draw a path in 3D with an imaginary "turtle"
- When you move the cursor over the genotype or select genotype sections, you will see them highlighted in the 3D structure
- By clicking on a 3D structure you can select its parts (you can extend the selection with SHIFT pressed) and the corresponding genes will be underlined
- Build an interesting shape, then click "OK" at the bottom of the window (the genotype should appear in the genotype list)
Simulation of the built structure.
- At the top left you can see the "Groups" window. Double-click "Creatures" and uncheck (disable) the "Death" checkbox. Thanks to this, when the energy of the simulated structure drops below zero, it will not be automatically removed from the simulation.
- Select a genotype in the genotype list, click the "Simulate" button in the same window, and in the small population selection menu select "Creatures".
- In the top toolbar you can see three red buttons like in the music player. The first button stops the simulation, the second one performs a single simulation step, and the third one turns on the simulation permanently.
- Turn on the simulation. You can adjust the simulation rate in the upper right corner of the "Artificial world" window that shows the simulated world.
- Selecting the simulated structure in the bottom "populations" window will cause the camera to zoom in on it.
- When the simulation is running, clicking on the structure with the left mouse button while holding down the CTRL key allows you to grab the structure with a "robot hand" and move it manually.
Exercise:
- Build a cube in f9 using the lowest number of letters and paste its genotype as the solution below.
/*9*/...Question 2
As you can see, the f9 representation is very simple. It does not allow to describe a neural network at all, and the structure itself consists of perpendicular elements of the same length. Assuming that structures with different element lengths and angles are also possible in general, the genotype-phenotype mapping ("embryogenesis") denoted as f9 is very restrictive.
Crossing over of two f9 genotypes is one-point crossover, while mutation has one parameter: "mutation intensity" – the fraction of genes (symbols, letters), which during the mutation of a genotype will be replaced with random ones. In the special case when this fraction is set to zero, exactly one gene will always be changed. The source code for the mutation and crossover can be found here.
We are about to test in practice what effects different values of this single mutation parameter have on the efficiency of evolution. The percentage of individuals subject to crossover and mutation itself is fixed and unchangeable – we are only testing the "intensity of the mutation operator" (how many genes in the genotype each mutation changes). Let's say that the optimization criterion will be the vertical position of the center of gravity of the structure. Before conducting experiments, first hypothesize: what do you expect? In general, will the "mutation intensity" significantly affect the process of the evolution of structures and the final results, and if so, how? Describe your prediction in your answer and justify it (this answer is not graded – it serves as a reference for further experimental verification).
Question 3
We will now prepare the infrastructure for further experiments in the lab class. In the file run-deap-examples.cmd you have examples of various calls that launch evolutionary optimization performed by the DEAP framework. DEAP is one of the more popular frameworks for evolutionary algorithms in python. If you have any doubts about how it specifically implements evolutionary optimization, you can take a look at the documentation.
The functions in the FramsticksEvolution.py source demonstrate how to connect an entirely independent optimization problem to the DEAP architecture. See how mutation, crossover, initial population generation and evaluation of an individual are plugged in. Then run a quick test run of the evolution (before you run it, read the description of the parameters below):
python FramsticksEvolution.py -path %DIR_WITH_FRAMS_LIBRARY%  -sim "eval-allcriteria.sim;deterministic.sim;sample-period-2.sim"  -opt vertpos -max_numparts 30 -max_numgenochars 50 -initialgenotype /*9*/BLU   -popsize 50
        -generations 20 -hof_size 1
The meaning of the parameters used:
-sim "eval-allcriteria.sim;deterministic.sim;sample-period-2.sim"– this argument is used to successively read settings from files with the extension.sim. These files must be copied to the subdirectorydata/in the Framsticks distribution (otherwise you would have to provide full paths). The structure of all data files used by Framsticks is simple: they consist of objects separated by a blank line (view a few.simfiles in a text editor). Each object is defined by its name (first line), which is followed by a set of linesparameter_name:value.
We could set parameter values directly in the python source, but using this argument allows us to keep the source unchanged for now, and handle everything with command-line arguments.-opt vertpos– we choose the optimization criterion: "vertpos". After evaluating a genotype (theframs_evaluate()function), The Framsticks environment will return a dictionary with the values of various criteria (such as the number of elements of the structure being evaluated, its velocity of movement, the number of simulation steps). "vertpos" corresponds to the vertical coordinate of the center of gravity of the evaluated structure – and this is what we are going to maximize.-max_numparts 30– structures exceeding 30 elements ("Parts") will get fitness=FITNESS_VALUE_INFEASIBLE_SOLUTION, and the selection mechanism will not select them.-max_numgenochars 50– analogous to the above, we discourage evolution from exceeding genotype lengths of 50.-initialgenotype /*9*/BLU– we start our evolution with a simple structure that already has a center of gravity slightly above the ground.-popsize 50– quick tests now, so small population-generations 20– quick tests now, so few generations-hof_size 1– the size of the "Hall of Fame": during evolution, we keep track of one best individual (but in DEAP, elitism does not work by default)- in response to this question, write how many individuals will be mutated in every generation of this experiment, how many individuals will be crossed over, in what order these operations are performed in DEAP, whether these two sets of individuals may or must overlap, and whether the next generation may include unmodified individuals (clones) and why.
After successfully running the command, you will see a simple statistic of the evolutionary process, and at the end you should see something similar to
Best individuals:
(0.8257831463424196,)   <--      /*9*/DDFBRFLUUU
Now let's say we want to run the evolution 10 times and save the genotype from the Hall of Fame to a separate file each time (you can then view the evolved structures in the Framsticks GUI by opening these files). We modify the command – we prepare a loop in our favorite shell, e.g. on Windows it can be:
for /L %%N in (1,1,10) do (
        python ....same-arguments-as-before.... -hof_savefile HoF-f9-%%N.gen
)
The main task remains – to test different mutation intensity values. Since we don't want to modify the source in python for now, instead we will achieve our goal using the shell and command-line parameters. We need to create a few files with settings, for example a file called f9-mut-0.sim will contain only two lines
sim_params:
f9_mut:0.0
The next file will be called f9-mut-005, and this file will set f9_mut to value 0.05 (meaning that 5% of genes will be mutated), and analogously for 10%, 20%, ..., 50% (remember to put the .sim files in the data/ directory).
Then in the shell script we add the top-level loop, e.g. under Windows:
for %%M in (0,005,010,020,other-intermediate-values,050) do (
    for /L %%N in (1,1,10) do (
        python -sim "eval-allcriteria.sim;deterministic.sim;sample-period-2.sim;f9-mut-%%M.sim"  ....same-as-before.... -hof_savefile HoF-f9-%%M-%%N.gen
    ))
and this will do the trick of testing different mutation intensities and repeating the evolutionary run 10 times for each intensity. We still have to prepare charts that will allow for convenient presentation of results and drawing conclusions.
Mutated:
Crossed over:
Order:
Whether the sets of mutated and crossed over individuals may or must overlap:
Are clones possible and why:
Question 4
For further experiments and analyses in all exercises, we will need three types of graphs:
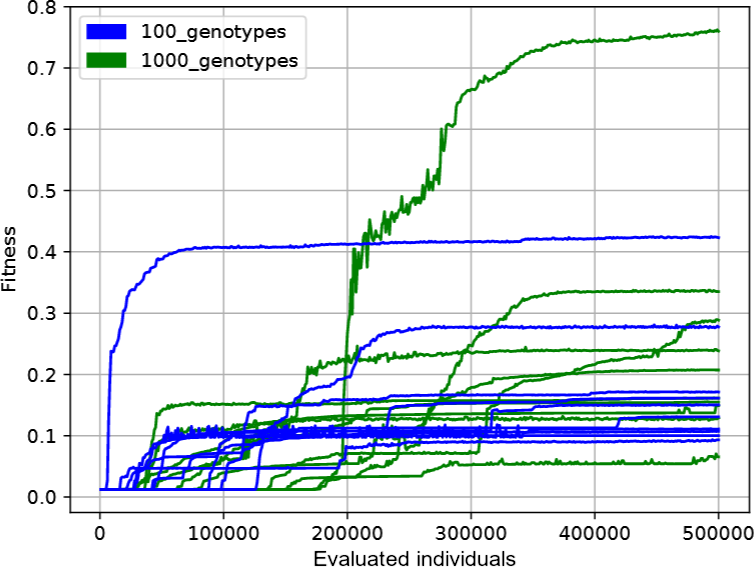
1. Showing each run of evolution (the best individual in a given generation) as one line; the same colors should be used for all lines with identical parameter values (i.e. in our case with the same mutation intensity). The deap.tools.Statistics class may be helpful. Such a graph should look similar to:

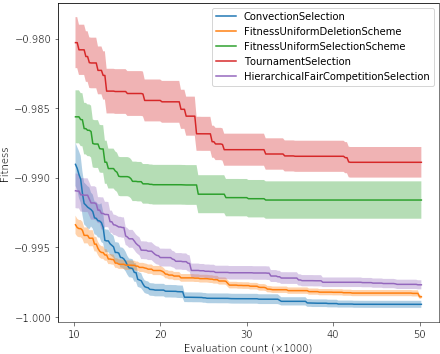
2. Aggregated version of the above chart, where from the above lines of a given color we calculate the mean and standard deviation. The deviation (which can be divided by some constant for readability so that the areas do not overlap) should be shown translucently, for example like this:

3. The most aggregated version, i.e. box plots comparing quality of solutions (only Hall of Fame individuals, one per each evolutionary run) and duration of runs (one value per each evolutionary run) for different parameterizations, for example:

You can freely modify the FramsticksEvolution.py source so that it is convenient for you to pass information both ways, save logs and results to files, etc. – the source serves as an example and a starting point. If you want to access the mutation intensity parameter directly from the python source, once you add import frams, this parameter is called frams.GenMan.f9_mut (this is an object, its method _value() will convert it to a float).
We are now ready to run the final experiments and test whether your original predictions about the effect of mutation intensity on evolutionary dynamics were correct. The computation is single-threaded, so if you have more cores available, you can easily parallelize it.
Earlier – for quick testing – we have set the -popsize and -generations parameters to small values. Now set -popsize to at least 50, and set-generations and -tournament to values that ensure convergence or only a minimal chance of improvement (since we did not prepare any more advanced charts, for this assessment use the first type of chart discussed at the beginning of this question).
Optionally: you can modify DEAP to support a new "stagnation period" parameter and to stop evolution by itself if, for a given number of generations (e.g. 50), there is no improvement of an individual in the Hall of Fame. Such a mechanism will also be useful in subsequent laboratory classes, because it frees us from setting a priori a fixed number of generations.
It is important not to stop evolution when improvements to the solutions still occur, because then we could draw false conclusions. Therefore, choose the stopping criterion properly.
In response to this question provide the parameter values used, attach the obtained graphs (name the files according to their content), interpret them and mention whether your initial assumptions turned out to be correct. What exactly caused the evolution to provide worse results for certain mutation intensities? What does this teach us about the desired way to create a "neighbor solution" from the "current solution" in optimization? Do the values of the mutation intensity that have lost in the current competition still have any advantages, and can you imagine situations in which these values would be the most advantageous?

